
As the Technology Master, you know exactly what to do to create scatter plots on many technology platforms. You will focus on making scatter plots on the graphing calculator and on the Google Sheets.
- Using a graphing calculator from the class set, first watch this video on how to graph a scatter plot. Then follow these step-by-step instructions to complete it on your own.
- Make a line of best fit on a graphing calculator.
- Watch this video to learn how to create a scatter plot on Google Sheets.
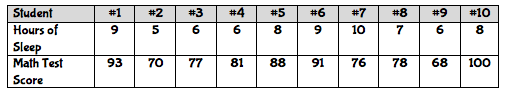
- Make a scatter plot and line of best fit on Google Sheets using this data from the picture:
Once you have read each of the websites, you must make slide #2 on your Google Sheets team page. Your slide must have information from each of the four parts that you read about above including the scatter plot that you made in step four.
Click here to go back to the Process.