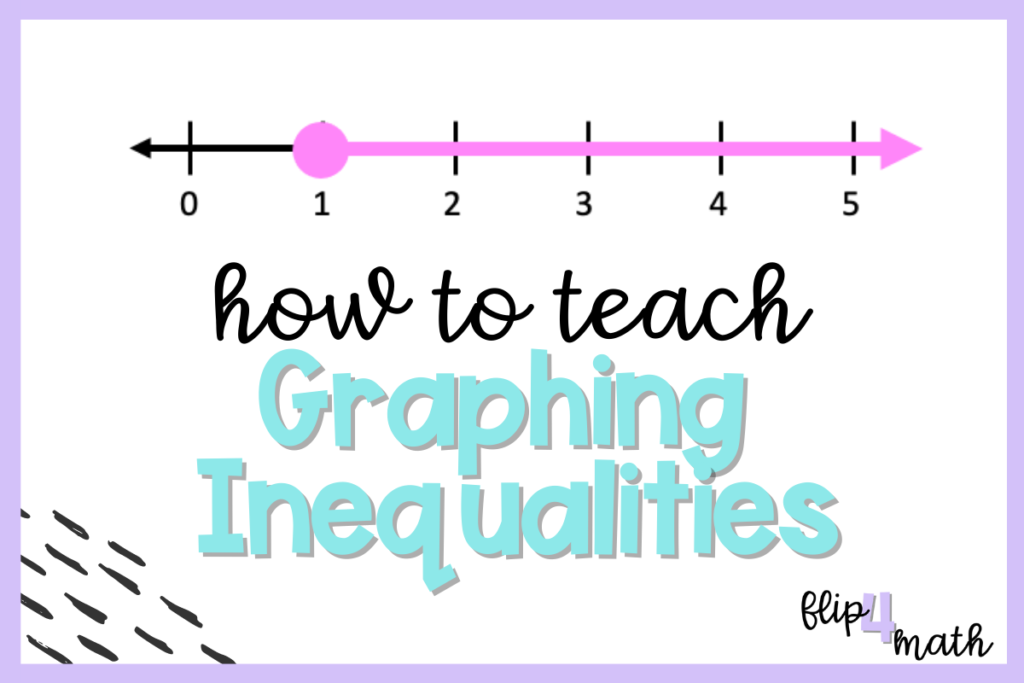
Telling the students the rules and expecting them to memorize them is one way to teach math. I like to teach through discovery, investigations and discussions. So in my classroom, we explore graphing inequalities through an investigation.
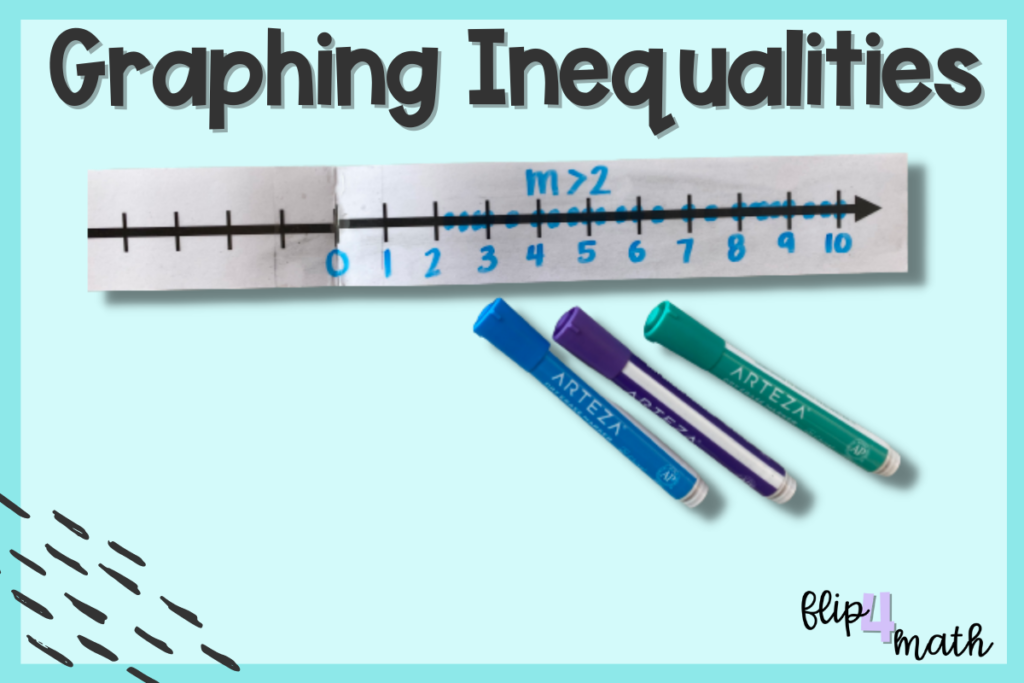
I give my students a dry erase number line and some dry erase markers. First I ask them what number should go in the middle? Zero – and then they practice numbering their number line.
Present the Situation
There are more than $2 in the piggy bank.
Then I ask them to put a dot on the number line of a possible solution to that situation. Most times the students will go through all of the whole numbers first. They will say 3, 4, 5, 6 and so on.
Are there any other possible answers? Some students may continue with whole numbers that are not on the number line. Then ask, how could we show that there are more answers further to the right that are also solutions? Look to get them to say to color the arrow.
Are there any other possible answers? What about $2.50? Where on the graph is that? Start to fill in more dots on the number line that represent decimal answers.
Now is the time to get them to recognize that the answers do not include 2 but every number as close to 2 as possible but larger than it. Ask them if 2 is a solution – no. What is the next largest number that is greater than 2? 2.1? 2.01? 2.001? Not in this case but in the case of greater than two. How do we show every number as close to 2 but greater than two?
Lead the students to put an open circle at two by asking if we can graph a point at 2 in this situation – no. So how do we show as close to two but greater than it? Use an open circle at two.
So have a student summarize the graph of x > 2. They should say we graph an open circle at 2 and shade to the right.
Expand Student Thinking on Graphing Inequalities
Now expand their thinking with x < 2. Then build on their thinking by giving them a ≤ or ≥ to see if they realize they need a filled in dot when it is equal to.
So through exploration and some prompting the students can come up with the graph on their own without you telling them. Does it take more time? Yes, but it will stick in their brain because they discovered it!
After the exploration, I jump into my foldable on inequalities with my students to write down what we have discovered as well as try some more practice problems.
If you want to try this engaging activity for teaching graphing of inequalities but you need the number lines, click here to get your free copy. This will also sign you up to be on my email list so you don’t miss out on my other cool math ideas and activities.


