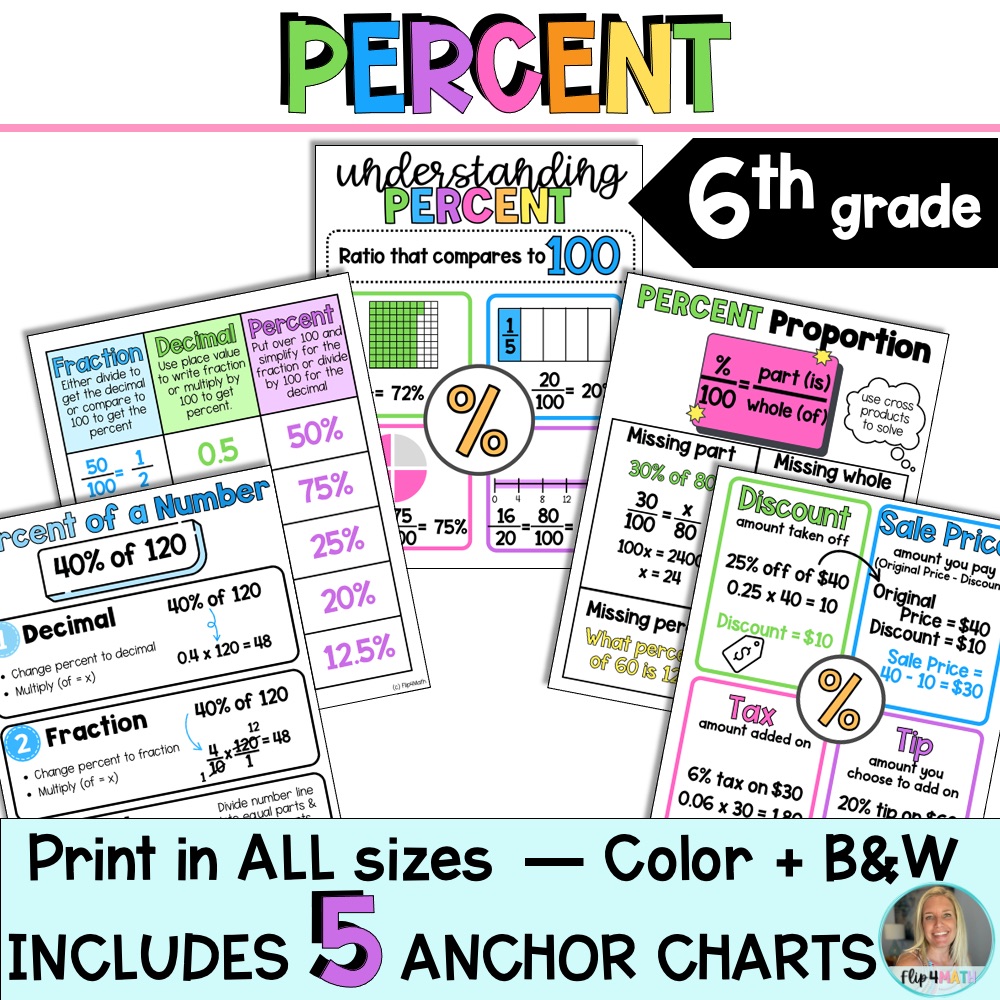
Make percents make sense with this set of 5 student-friendly anchor charts designed for 6th grade math! These printable posters help students build a strong conceptual understanding of percents, while also making real-world applications like tax, tip, and discounts more accessible.
Description
Make percents make sense with this set of 5 student-friendly anchor charts designed for 6th grade math! These printable posters help students build a strong conceptual understanding of percents, while also making real-world applications like tax, tip, and discounts more accessible.
Topics Included:
Understanding Percents
Converting Fractions, Decimals, and Percents
Finding Percent of a Number
Using the Percent Proportion
Calculating Discount, Tax, Tip, and Sale Price
These anchor charts are perfect for introducing percent concepts, reinforcing key skills during practice, or using as handy reference tools during word problems and assessments. They’re great for classroom displays, math notebooks, centers, or intervention groups.
Product Features:
✅ Includes 5 anchor charts in PDF format
✅ Comes in full-color and black & white versions
✅ Printable on 8.5×11, half-page, or quarter-page sizes
✅ Can be enlarged to poster size for visual displays
✅ Printing tutorial video included
✅ Aligned with 6th grade math standards
✅ Ideal for visual learners and real-world math connections
Support your students in mastering percent skills with these visually engaging and easy-to-use anchor charts that bring math to life!
Standards: 6.RP.A.3c
Additional information
| Resource Type | Anchor Charts & Posters, Classroom Decor & Bulletin Boards |
|---|