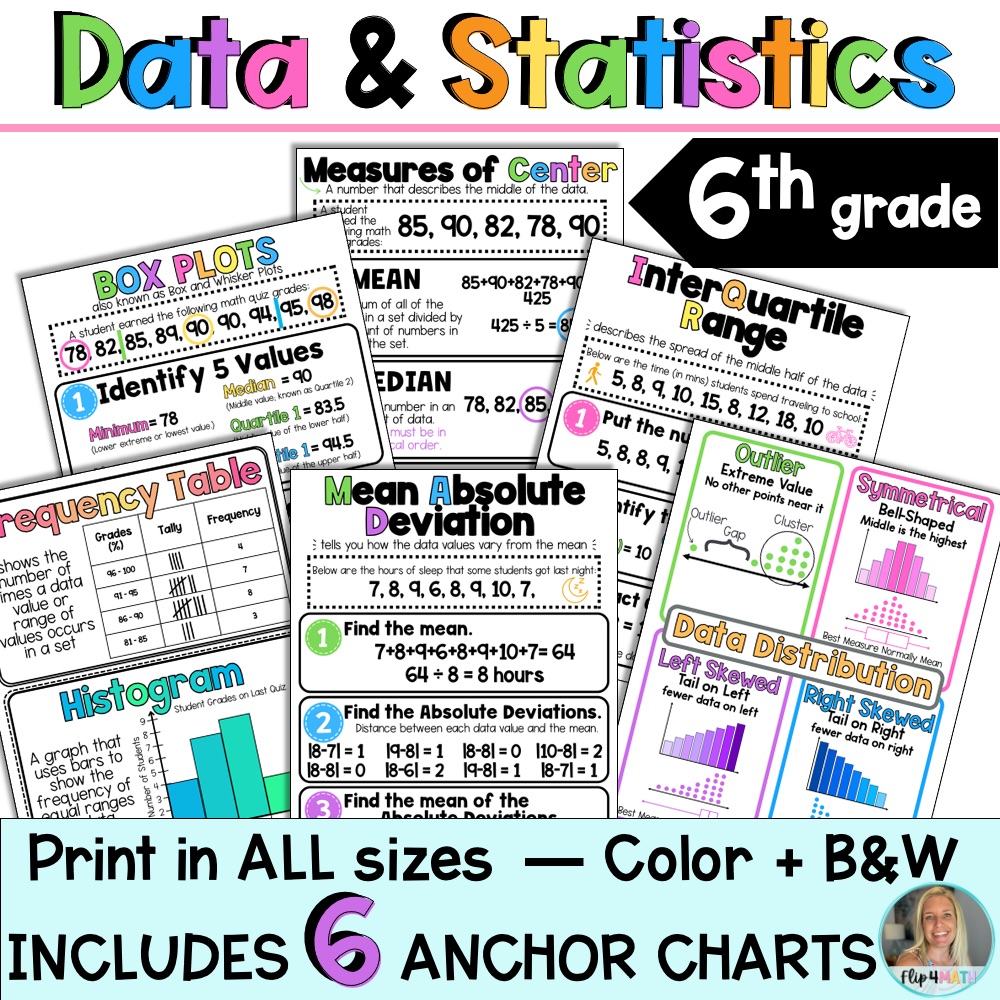
Help your 6th grade students confidently analyze and interpret data with this set of 6 printable Data & Statistics anchor charts! These visually engaging posters are perfect for breaking down complex concepts like measures of center, variability, and data displays into student-friendly language.
Description
Help your 6th grade students confidently analyze and interpret data with this set of 6 printable Data & Statistics anchor charts! These visually engaging posters are perfect for breaking down complex concepts like measures of center, variability, and data displays into student-friendly language.
Topics Included:
Measures of Center: Mean, Median, and Mode
Box Plots (Box-and-Whisker Plots)
Frequency Tables and Histograms
Mean Absolute Deviation (MAD)
Interquartile Range (IQR)
Skewed Data, Data Distribution, and Outliers
Use these charts to introduce key vocabulary, provide visual support during instruction, and reinforce essential data concepts all year long. They’re ideal for math notebooks, classroom displays, test prep, and small group work.
Product Features:
✅ Includes 6 anchor charts in PDF format
✅ Comes in color and black & white versions
✅ Printable on 8.5×11, half-page, or quarter-page formats
✅ Easily enlarge to poster size for classroom use
✅ Printing tutorial video included
✅ Aligned with 6th grade math and data standards
✅ Supports visual learners and boosts student understanding
These anchor charts are the perfect reference tools to help students organize, display, and analyze data like pros!
Standards: 6.SP.A.1; 6.SP.A.2; 6.SP.A.3; 6.SP.B.4; 6.SP.B.5c; 6.SP.B.5d
Additional information
| Resource Type | Anchor Charts & Posters, Classroom Decor & Bulletin Boards |
|---|